Historical Values
-
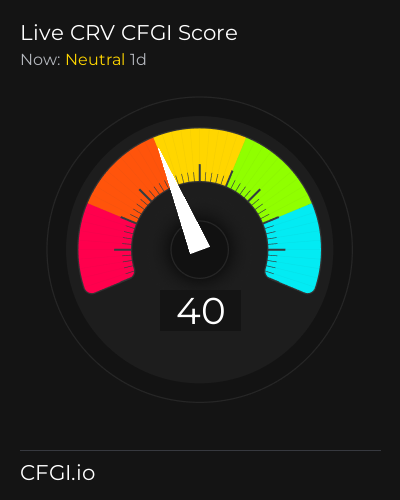
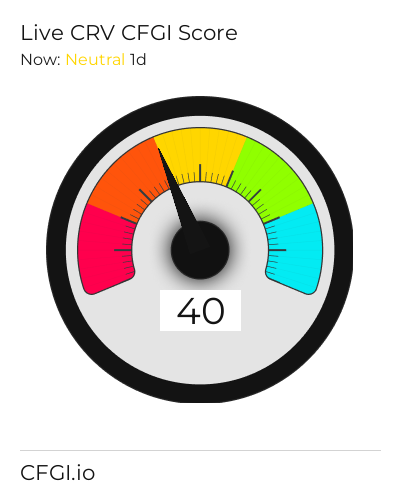
Now
Neutral 40 -
Yesterday
Neutral 40 -
7 Days Ago
Neutral 40 -
1 Month Ago
Neutral 40
Curve Breakdown
Price Score Neutral
The Price Score indicator is a relevant indicator to analyze and assign the Curve price evolution a certain numerical value.
This module studies the price trend to determine if the Curve market has a bearish or bullish trend.
The main trend defines one part of the general sentiment of the market, and is a factor of weight when analyzing a chart. A pronounced and long-lasting positive trend generates a greater feeling of greed. In the same way, when the trend is negative, a greater feeling of fear is generated, regardless of other factors.
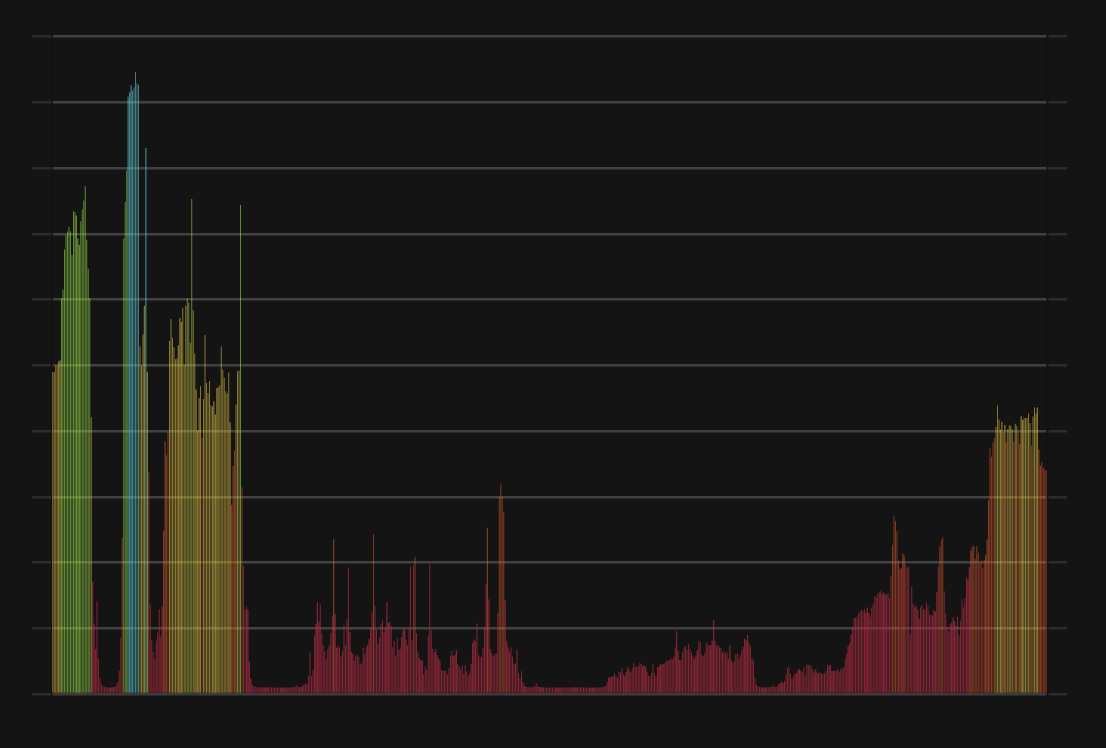
Volatility Fear
Price Volatility is also another important indicator and the biggest trigger for market sentiment. To measure it, we use values between 0 and 1 that determine the degree of current Curve price fluctuation for the desired time frame.
Higher volatility implies a riskier market, which further polarizes bullish and bearish sentiments. An increase in volatility implies greater greed in a bull market, but also greater fear in a bear market.
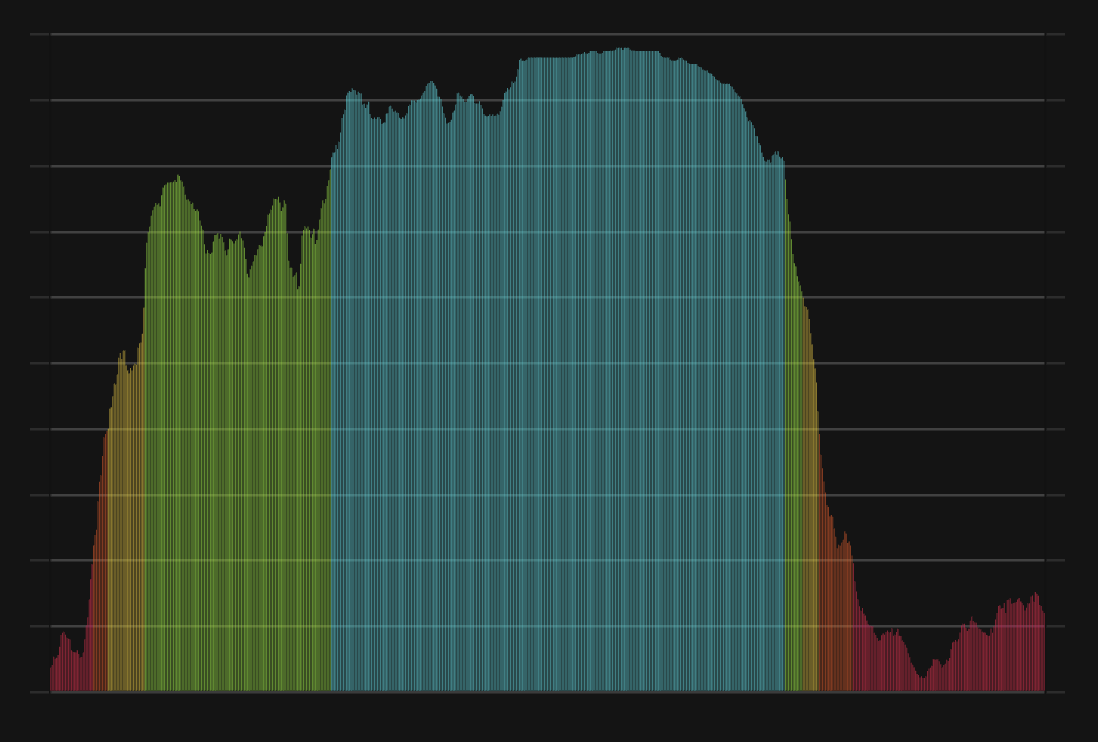
Volume Fear
Like volatility, the Curve Volume is a determining factor.
An increase in the volume implies a greater negotiation in the market, which is caused by an increase in the movements caused by an interest, which is synonymous with great sentiment. A strong volume determines a strong level of greed in Curve bull markets, but also a strong level of panic in bear markets.
Like volatility, it is also calculated with a range between 0 and 1.
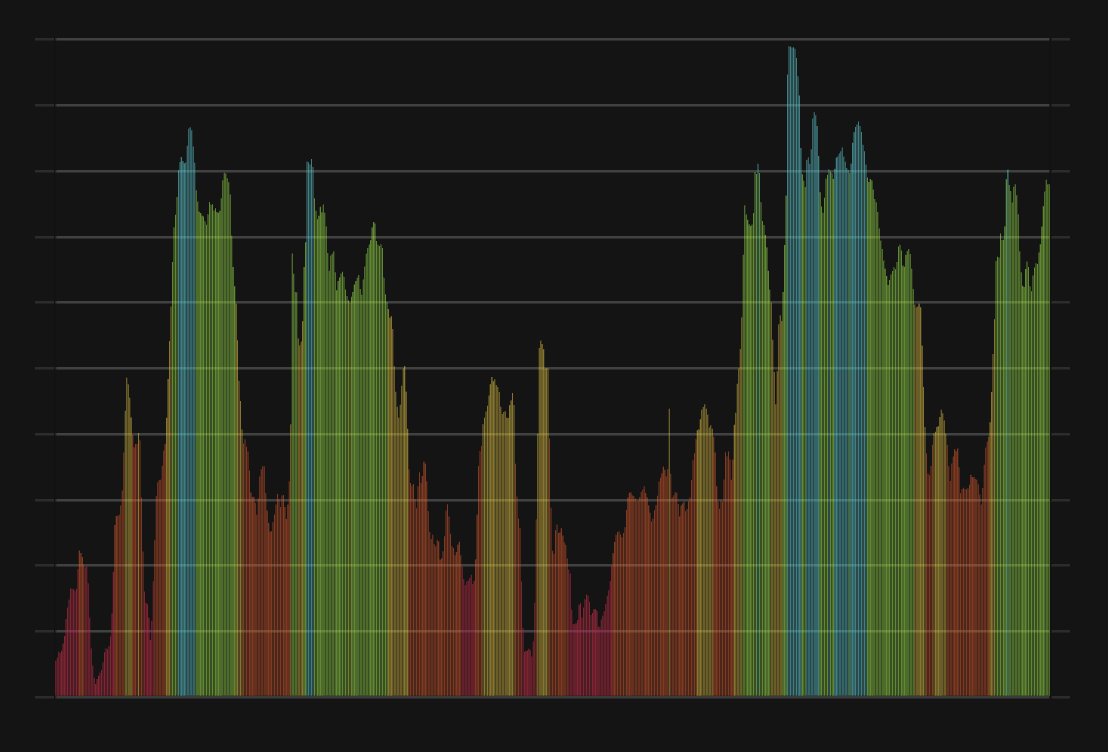
Impulse Neutral
The Impulse indicator measures the current Curve price strength compared to previous values to determine in a range from -1 to 1 how it is affecting the Curve market sentiment.
Impulse has a huge impact on sentiment, as on a psychological level we tend to place more importance on the latest price move.
The strength of this shows price inclination that can be more or less pronounced and determines the polarity. A strong bullish impulse in a market implies a greater feeling of greed, in the same way that a strong bearish impulse generates a greater feeling of fear or panic.
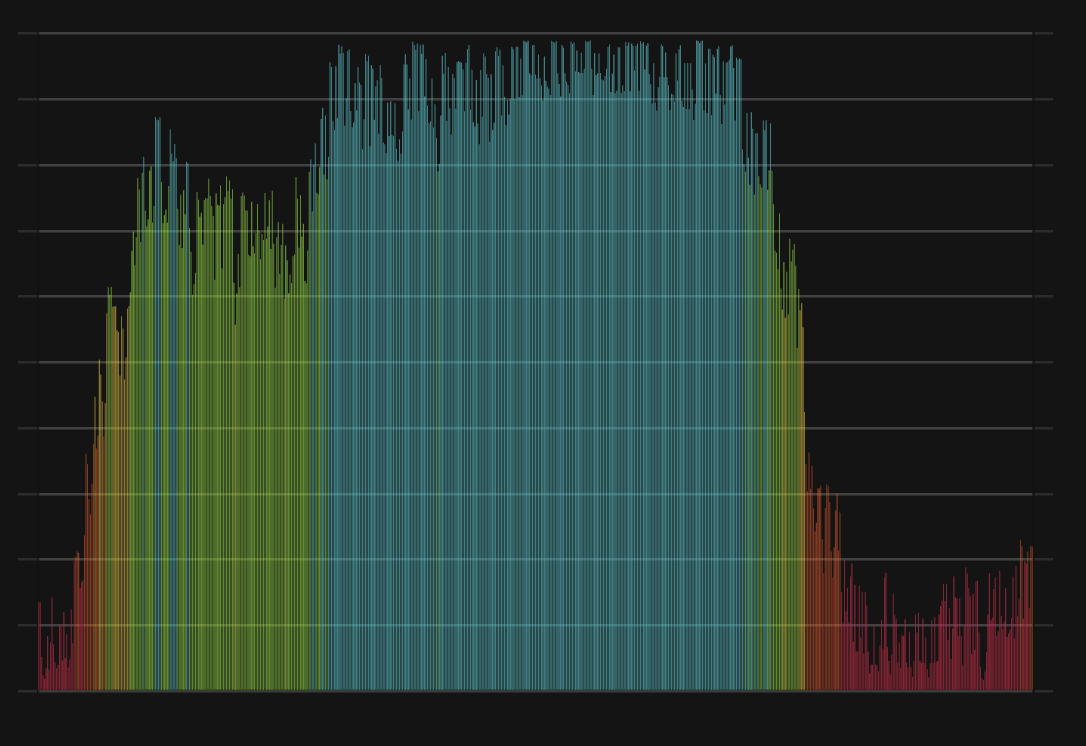
Technical Neutral
It is proven that technical analyzes themselves influence market sentiment, especially those that are more popular.
The technical analysis indicator analyzes for Curve the 26 most popular stock market indicators and subdivides them into 2 main categories that differentiate them in their type of trend indicator or oscillator. Subsequently, each one of them is averaged and assigned a certain weight based on the popularity of each one. These results fairly accurately reflect the impact generated by these charts on market analysts.
Social Extreme Fear
Dominance Greed
This other indicator takes into account the dominance of Curve with respect to the general market. When it gets greedy, altcoin investments greatly increase and the total market capitalization increases, which also decreases Curve's dominance. The same thing happens when the market panics but in reverse. For this reason, both the token capitalization and the total market capitalization are calculated.
But there is also a correlation between the dominance of Curve and the dominance of the main altcoins, so the indicator calculates different values for each cryptocurrency.
Search Extreme Fear
Trends is another factor that determines the sentiment of a particular market. We analyze the search volume on Curve has on major search engines on Google.
The lookup indicator looks at the current value and compares it to previous values to determine what particular interest there is in Curve. For this, specific search terms are used that determine the purchasing or ceding interest of Curve, thus excluding general terms that only define popularity without demonstrating negativity or possibility.
Whales Greed
One of the analyzes that can determine the cryptocurrency market is the movement of whales.
CFGI analyzes the movements of superlative amounts made by large investors in two ways, first it analyzes large movements from wallets to exchanges of Curve and compares them with the large movements of stable coins that are also made from wallets to exchanges to estimate the proportion of purchase and sale to be made.
A high ratio of Curve moves to stablecoins indicates strong selling intent which means greed market, while a higher ratio of stablecoins moves indicates stronger buying intent and fear market.
Order Book Neutral
Another great predictor of sentiment through a quantitative source are the order books. Crypto Fear and Greed Index analyzes the order book for Curve on a popular exchange to determine the buying and selling pressure that contiguous orders exert on the price. In such a way that you can know the buying and selling pressure that the orders which are going to be executed will exert.
Stronger buying pressure than selling pressure close to price is a clear indication of bearish sentiment, as there are more buy orders within equal distance to the price. While stronger selling pressure above price indicates a bullish sentiment, because there are more sells to execute than buys at the same distance.
Curve News
CRV Price Prediction: Shorts Are Piled In and $0.22 Is the Only Trigger That Matters

Sentiment: Positive
Read moreCRV Price Prediction: Dead Below Every Major MA With $0.18 Lower Band Squarely in Play

Sentiment: Negative
Read moreCRV Price Prediction: Bears Have the Controls — $0.20 Support Is the Last Line Before $0.18

Sentiment: Negative
Read more
CRV Price Prediction: Rally Running on Fumes — $0.22 Retest Likely Before Any Shot at $0.28

Sentiment: Negative
Read moreCRV Price Prediction: $0.28 or Bust — Upper Band Resistance Is the Only Trade That Matters

Sentiment: Negative
Read moreCRV Price Prediction: $0.25 Make-or-Break — Smart Money Is Leaning Long but the Chart Isn't Convincing Yet

Sentiment: Neutral
Read moreCurve DAO slides after $0.266 rejection – Here's why CRV sellers still lead

Sentiment: Negative
Read moreCRV Price Prediction: $0.28 Target or $0.23 Support Test Within Two Weeks

Sentiment: Positive
Read moreBitcoin Holds Steady While Curve DAO (CRV) and Stargate Finance (STG) Lead the Altcoin Rally
Sentiment: Positive
Read moreCRV Price Prediction: $0.40 Target in Sight as Bulls Break Key Resistance

Sentiment: Positive
Read moreCurve DAO Token Surges 18% — Why Traders Are Suddenly Watching CRV Token
Sentiment: Positive
Read moreCRV Price Prediction: Bulls Target $0.24 Breakout as Consolidation Phase Nears Critical Decision Point

Sentiment: Positive
Read more
CRV Price Prediction: $0.22 Target as Smart Money Accumulates Despite Bearish Technicals

Sentiment: Positive
Read more
CRV Price Prediction: $0.30 Target or $0.17 Support Break in Next 72 Hours

Sentiment: Negative
Read moreCRV Price Prediction: Bulls Stacking at $0.20 Floor, $0.25 Break Imminent

Sentiment: Positive
Read more
CRV Price Prediction: $0.18 Target Looms as Technical Bears Take Control

Sentiment: Negative
Read more
CRV Price Prediction: $0.30 Target Within 6 Weeks as Technical Setup Strengthens

Sentiment: Positive
Read moreCRV Price Prediction: $0.36 Breakout or $0.19 Capitulation Within 10 Days

Sentiment: Positive
Read more

CRV Price Prediction: $0.36 Breakout Target as Retail Shorts Face June Squeeze

Sentiment: Positive
Read moreCRV Price Prediction: $0.36 Relief Rally or $0.20 Breakdown - 48 Hours to Decide

Sentiment: Negative
Read more
CRV Price Prediction: Bulls Target $0.28 Breakout as Smart Money Accumulates

Sentiment: Positive
Read moreCurve DAO [CRV] price prediction – Traders, watch out for this market opportunity!
![Curve DAO [CRV] price prediction – Traders, watch out for this market opportunity!](https://crypto.snapi.dev/images/v1/a/c/9/curve-dao-featured-e1779252146-930423.webp)
Sentiment: Positive
Read moreCRV Price Prediction: $0.22 Support Crumbles as DeFi Selloff Accelerates

Sentiment: Negative
Read moreCRV Price Prediction: Dead Cat Bounce to $0.27 Before $0.20 Capitulation

Sentiment: Negative
Read more
CRV Price Prediction: $0.35 Target Within 14 Days as Technical Divergence Builds
Sentiment: Positive
Read moreCRV Price Prediction: Bulls Eye $0.30 Target But Risk Cascade to $0.22 Looms

Sentiment: Negative
Read moreCRV Price Prediction: $0.30 Target Within 30 Days as Smart Money Builds Massive Positions

Sentiment: Positive
Read more
CRV Price Prediction: Bulls Target $0.35 as Whales Drive 67% Long Positioning

Sentiment: Positive
Read moreCRV Price Prediction: $0.28 Target as Whales Load Up Despite Stalled Momentum

Sentiment: Positive
Read moreCRV Price Prediction: $0.27 Target as Bulls Test Critical Resistance Zone

Sentiment: Positive
Read moreCRV Price Prediction: Institutional Flow Points to $0.30 Breakout Within Three Weeks

Sentiment: Positive
Read moreCRV Price Prediction: Institutional Money Targets $0.30 Breakout Within 30 Days

Sentiment: Positive
Read moreCurve Finance Launches Recovery Path for Affected CRV-Long LlamaLend Market Lenders
Sentiment: Positive
Read moreCRV Price Prediction: $0.28 Breakout Target as DeFi Infrastructure Gains Traction

Sentiment: Positive
Read more
CRV Price Prediction: Consolidation Phase Eyes $0.45 Breakout by Late 2026

Sentiment: Positive
Read moreCRV Price Prediction: Breakout to $0.29 Within 10 Days as Smart Money Doubles Down

Sentiment: Positive
Read moreCRV Price Prediction: Technical Squeeze Sets Up $0.30 Target Before $0.18 Breakdown
Sentiment: Negative
Read more

CRV Price Prediction: Neutral Consolidation Eyes $0.25 Breakout by May 2026

Sentiment: Positive
Read more
CRV Price Prediction: Targets $0.235 by May as Technical Indicators Show Mixed Signals

Sentiment: Positive
Read moreCRV Price Prediction: Curve Eyes $0.24 Breakout as Technical Indicators Signal Neutral Territory

Sentiment: Neutral
Read moreCRV Price Prediction: Curve Targets $0.25 Resistance by End of April 2026

Sentiment: Positive
Read moreCRV Price Prediction: Curve Targets $0.25 Breakout After Testing $0.20 Support

Sentiment: Positive
Read moreCRV Price Prediction: Curve Targets $0.25 Breakout Amid Technical Consolidation

Sentiment: Positive
Read moreCRV Price Prediction: Curve Eyes $0.26 Recovery Despite March Volatility

Sentiment: Positive
Read moreCRV Price Prediction: Curve Targets $0.26 Breakout as Technical Indicators Show Mixed Signals

Sentiment: Positive
Read moreCRV Price Prediction: Curve Eyes $0.24 Breakout as RSI Stabilizes in March 2026

Sentiment: Positive
Read more
CRV Price Prediction: Curve Eyes $0.26 Breakout as Technical Indicators Flash Mixed Signals

Sentiment: Positive
Read moreCRV Price Prediction: Curve Eyes $0.26 Recovery as RSI Shows Oversold Bounce Potential

Sentiment: Positive
Read moreCRV Price Prediction: Curve Targets $0.24 Recovery by April Amid Technical Consolidation

Sentiment: Positive
Read moreCRV Price Prediction: Targets $0.27 by April as Technical Recovery Shows Promise
Sentiment: Positive
Read more
CRV Price Prediction: Targets $0.27 Recovery by Month-End Despite Technical Headwinds

Sentiment: Positive
Read more
CRV Price Prediction: Targets $0.27 by End of March as Technical Recovery Emerges

Sentiment: Positive
Read moreCRV Price Prediction: Targets $0.27 Recovery by Late March as Support Holds
Sentiment: Positive
Read moreCRV price slides towards range lows as LlamaLend pool exploit weighs on sentiment
Sentiment: Negative
Read more
CRV Price Prediction: Curve Eyes $0.28 Breakout as Technical Indicators Show Mixed Signals

Sentiment: Positive
Read moreCRV Price Prediction: Curve Eyes $0.28 Breakout as Technical Indicators Show Mixed Signals

Sentiment: Positive
Read more
Curve News
CRV Price Prediction: Shorts Are Piled In and $0.22 Is the Only Trigger That Matters
Sentiment: Positive
Read moreCRV Price Prediction: Dead Below Every Major MA With $0.18 Lower Band Squarely in Play
Sentiment: Negative
Read moreCRV Price Prediction: Bears Have the Controls — $0.20 Support Is the Last Line Before $0.18
Sentiment: Negative
Read moreCRV Price Prediction: Rally Running on Fumes — $0.22 Retest Likely Before Any Shot at $0.28
Sentiment: Negative
Read moreCRV Price Prediction: $0.28 or Bust — Upper Band Resistance Is the Only Trade That Matters
Sentiment: Negative
Read moreCRV Price Prediction: $0.25 Make-or-Break — Smart Money Is Leaning Long but the Chart Isn't Convincing Yet
Sentiment: Neutral
Read moreCurve DAO slides after $0.266 rejection – Here's why CRV sellers still lead
Sentiment: Negative
Read moreCRV Price Prediction: $0.28 Target or $0.23 Support Test Within Two Weeks
Sentiment: Positive
Read moreBitcoin Holds Steady While Curve DAO (CRV) and Stargate Finance (STG) Lead the Altcoin Rally
Sentiment: Positive
Read moreCRV Price Prediction: $0.40 Target in Sight as Bulls Break Key Resistance
Sentiment: Positive
Read moreCurve DAO Token Surges 18% — Why Traders Are Suddenly Watching CRV Token
Sentiment: Positive
Read moreCRV Price Prediction: Bulls Target $0.24 Breakout as Consolidation Phase Nears Critical Decision Point
Sentiment: Positive
Read moreCRV Price Prediction: $0.22 Target as Smart Money Accumulates Despite Bearish Technicals
Sentiment: Positive
Read moreCRV Price Prediction: $0.30 Target or $0.17 Support Break in Next 72 Hours
Sentiment: Negative
Read moreCRV Price Prediction: Bulls Stacking at $0.20 Floor, $0.25 Break Imminent
Sentiment: Positive
Read moreCRV Price Prediction: $0.18 Target Looms as Technical Bears Take Control
Sentiment: Negative
Read moreCRV Price Prediction: $0.30 Target Within 6 Weeks as Technical Setup Strengthens
Sentiment: Positive
Read moreCRV Price Prediction: $0.36 Breakout or $0.19 Capitulation Within 10 Days
Sentiment: Positive
Read moreCRV Price Prediction: $0.36 Breakout Target as Retail Shorts Face June Squeeze
Sentiment: Positive
Read moreCRV Price Prediction: $0.36 Relief Rally or $0.20 Breakdown - 48 Hours to Decide
Sentiment: Negative
Read moreCRV Price Prediction: Bulls Target $0.28 Breakout as Smart Money Accumulates
Sentiment: Positive
Read moreCurve DAO [CRV] price prediction – Traders, watch out for this market opportunity!
Sentiment: Positive
Read moreCRV Price Prediction: $0.22 Support Crumbles as DeFi Selloff Accelerates
Sentiment: Negative
Read moreCRV Price Prediction: Dead Cat Bounce to $0.27 Before $0.20 Capitulation
Sentiment: Negative
Read moreCRV Price Prediction: $0.35 Target Within 14 Days as Technical Divergence Builds
Sentiment: Positive
Read moreCRV Price Prediction: Bulls Eye $0.30 Target But Risk Cascade to $0.22 Looms
Sentiment: Negative
Read moreCRV Price Prediction: $0.30 Target Within 30 Days as Smart Money Builds Massive Positions
Sentiment: Positive
Read moreCRV Price Prediction: Bulls Target $0.35 as Whales Drive 67% Long Positioning
Sentiment: Positive
Read moreCRV Price Prediction: $0.28 Target as Whales Load Up Despite Stalled Momentum
Sentiment: Positive
Read moreCRV Price Prediction: $0.27 Target as Bulls Test Critical Resistance Zone
Sentiment: Positive
Read moreCRV Price Prediction: Institutional Flow Points to $0.30 Breakout Within Three Weeks
Sentiment: Positive
Read moreCRV Price Prediction: Institutional Money Targets $0.30 Breakout Within 30 Days
Sentiment: Positive
Read moreCurve Finance Launches Recovery Path for Affected CRV-Long LlamaLend Market Lenders
Sentiment: Positive
Read moreCRV Price Prediction: $0.28 Breakout Target as DeFi Infrastructure Gains Traction
Sentiment: Positive
Read moreCRV Price Prediction: Consolidation Phase Eyes $0.45 Breakout by Late 2026
Sentiment: Positive
Read moreCRV Price Prediction: Breakout to $0.29 Within 10 Days as Smart Money Doubles Down
Sentiment: Positive
Read moreCRV Price Prediction: Technical Squeeze Sets Up $0.30 Target Before $0.18 Breakdown
Sentiment: Negative
Read moreCRV Price Prediction: Neutral Consolidation Eyes $0.25 Breakout by May 2026
Sentiment: Positive
Read moreCRV Price Prediction: Targets $0.235 by May as Technical Indicators Show Mixed Signals
Sentiment: Positive
Read moreCRV Price Prediction: Curve Eyes $0.24 Breakout as Technical Indicators Signal Neutral Territory
Sentiment: Neutral
Read moreCRV Price Prediction: Curve Targets $0.25 Resistance by End of April 2026
Sentiment: Positive
Read moreCRV Price Prediction: Curve Targets $0.25 Breakout After Testing $0.20 Support
Sentiment: Positive
Read moreCRV Price Prediction: Curve Targets $0.25 Breakout Amid Technical Consolidation
Sentiment: Positive
Read moreCRV Price Prediction: Curve Eyes $0.26 Recovery Despite March Volatility
Sentiment: Positive
Read moreCRV Price Prediction: Curve Targets $0.26 Breakout as Technical Indicators Show Mixed Signals
Sentiment: Positive
Read moreCRV Price Prediction: Curve Eyes $0.24 Breakout as RSI Stabilizes in March 2026
Sentiment: Positive
Read moreCRV Price Prediction: Curve Eyes $0.26 Breakout as Technical Indicators Flash Mixed Signals
Sentiment: Positive
Read moreCRV Price Prediction: Curve Eyes $0.26 Recovery as RSI Shows Oversold Bounce Potential
Sentiment: Positive
Read moreCRV Price Prediction: Curve Targets $0.24 Recovery by April Amid Technical Consolidation
Sentiment: Positive
Read moreCRV Price Prediction: Targets $0.27 by April as Technical Recovery Shows Promise
Sentiment: Positive
Read moreCRV Price Prediction: Targets $0.27 Recovery by Month-End Despite Technical Headwinds
Sentiment: Positive
Read moreCRV Price Prediction: Targets $0.27 by End of March as Technical Recovery Emerges
Sentiment: Positive
Read moreCRV Price Prediction: Targets $0.27 Recovery by Late March as Support Holds
Sentiment: Positive
Read moreCRV price slides towards range lows as LlamaLend pool exploit weighs on sentiment
Sentiment: Negative
Read moreCRV Price Prediction: Curve Eyes $0.28 Breakout as Technical Indicators Show Mixed Signals
Sentiment: Positive
Read moreCRV Price Prediction: Curve Eyes $0.28 Breakout as Technical Indicators Show Mixed Signals
Sentiment: Positive
Read moreHistorical Values
-
Now
Neutral 40 -
Yesterday
Neutral 40 -
7 Days Ago
Neutral 40 -
1 Month Ago
Neutral 41
Curve Breakdown
Price Score Neutral
The Price Score indicator is a relevant indicator to analyze and assign the Curve price evolution a certain numerical value.
This module studies the price trend to determine if the Curve market has a bearish or bullish trend.
The main trend defines one part of the general sentiment of the market, and is a factor of weight when analyzing a chart. A pronounced and long-lasting positive trend generates a greater feeling of greed. In the same way, when the trend is negative, a greater feeling of fear is generated, regardless of other factors.
Volatility Fear
Price Volatility is also another important indicator and the biggest trigger for market sentiment. To measure it, we use values between 0 and 1 that determine the degree of current Curve price fluctuation for the desired time frame.
Higher volatility implies a riskier market, which further polarizes bullish and bearish sentiments. An increase in volatility implies greater greed in a bull market, but also greater fear in a bear market.
Volume Fear
Like volatility, the Curve Volume is a determining factor.
An increase in the volume implies a greater negotiation in the market, which is caused by an increase in the movements caused by an interest, which is synonymous with great sentiment. A strong volume determines a strong level of greed in Curve bull markets, but also a strong level of panic in bear markets.
Like volatility, it is also calculated with a range between 0 and 1.
Impulse Neutral
The Impulse indicator measures the current Curve price strength compared to previous values to determine in a range from -1 to 1 how it is affecting the Curve market sentiment.
Impulse has a huge impact on sentiment, as on a psychological level we tend to place more importance on the latest price move.
The strength of this shows price inclination that can be more or less pronounced and determines the polarity. A strong bullish impulse in a market implies a greater feeling of greed, in the same way that a strong bearish impulse generates a greater feeling of fear or panic.
Technical Neutral
It is proven that technical analyzes themselves influence market sentiment, especially those that are more popular.
The technical analysis indicator analyzes for Curve the 26 most popular stock market indicators and subdivides them into 2 main categories that differentiate them in their type of trend indicator or oscillator. Subsequently, each one of them is averaged and assigned a certain weight based on the popularity of each one. These results fairly accurately reflect the impact generated by these charts on market analysts.
Social Extreme Fear
Dominance Greed
This other indicator takes into account the dominance of Curve with respect to the general market. When it gets greedy, altcoin investments greatly increase and the total market capitalization increases, which also decreases Curve's dominance. The same thing happens when the market panics but in reverse. For this reason, both the token capitalization and the total market capitalization are calculated.
But there is also a correlation between the dominance of Curve and the dominance of the main altcoins, so the indicator calculates different values for each cryptocurrency.
Search Extreme Fear
Trends is another factor that determines the sentiment of a particular market. We analyze the search volume on Curve has on major search engines on Google.
The lookup indicator looks at the current value and compares it to previous values to determine what particular interest there is in Curve. For this, specific search terms are used that determine the purchasing or ceding interest of Curve, thus excluding general terms that only define popularity without demonstrating negativity or possibility.
Whales Greed
One of the analyzes that can determine the cryptocurrency market is the movement of whales.
CFGI analyzes the movements of superlative amounts made by large investors in two ways, first it analyzes large movements from wallets to exchanges of Curve and compares them with the large movements of stable coins that are also made from wallets to exchanges to estimate the proportion of purchase and sale to be made.
A high ratio of Curve moves to stablecoins indicates strong selling intent which means greed market, while a higher ratio of stablecoins moves indicates stronger buying intent and fear market.
Order Book Neutral
Another great predictor of sentiment through a quantitative source are the order books. Crypto Fear and Greed Index analyzes the order book for Curve on a popular exchange to determine the buying and selling pressure that contiguous orders exert on the price. In such a way that you can know the buying and selling pressure that the orders which are going to be executed will exert.
Stronger buying pressure than selling pressure close to price is a clear indication of bearish sentiment, as there are more buy orders within equal distance to the price. While stronger selling pressure above price indicates a bullish sentiment, because there are more sells to execute than buys at the same distance.
CRV Price
1 CRV = $0.21
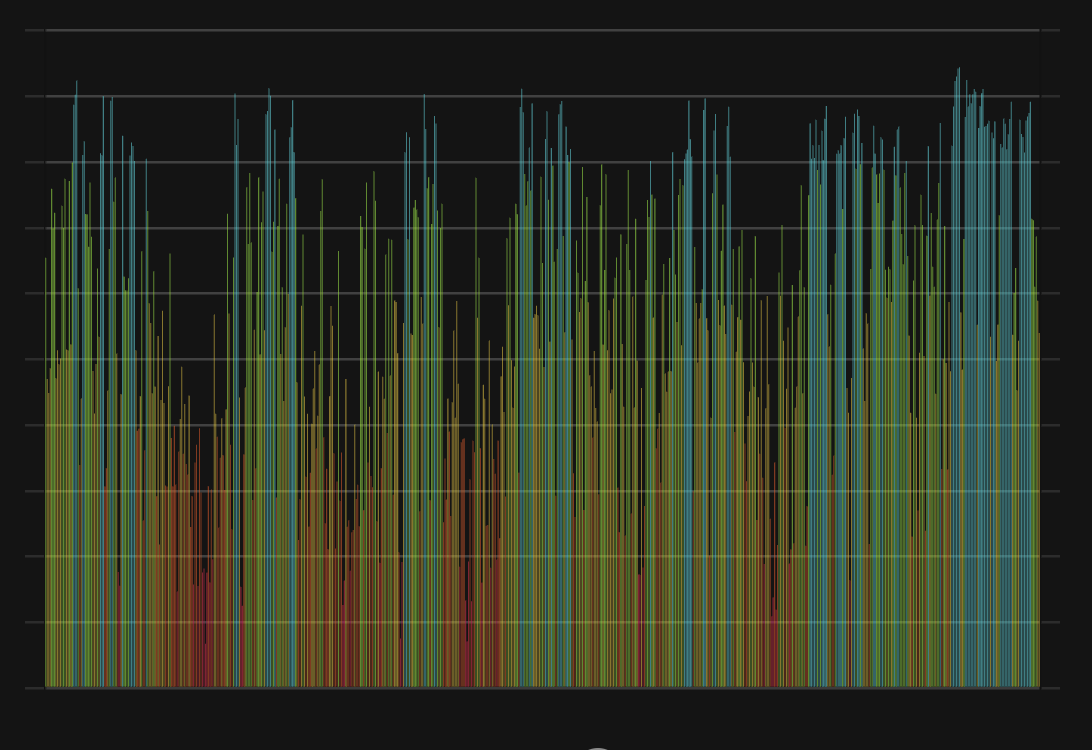
Curve CFGI Score & CRV Price History
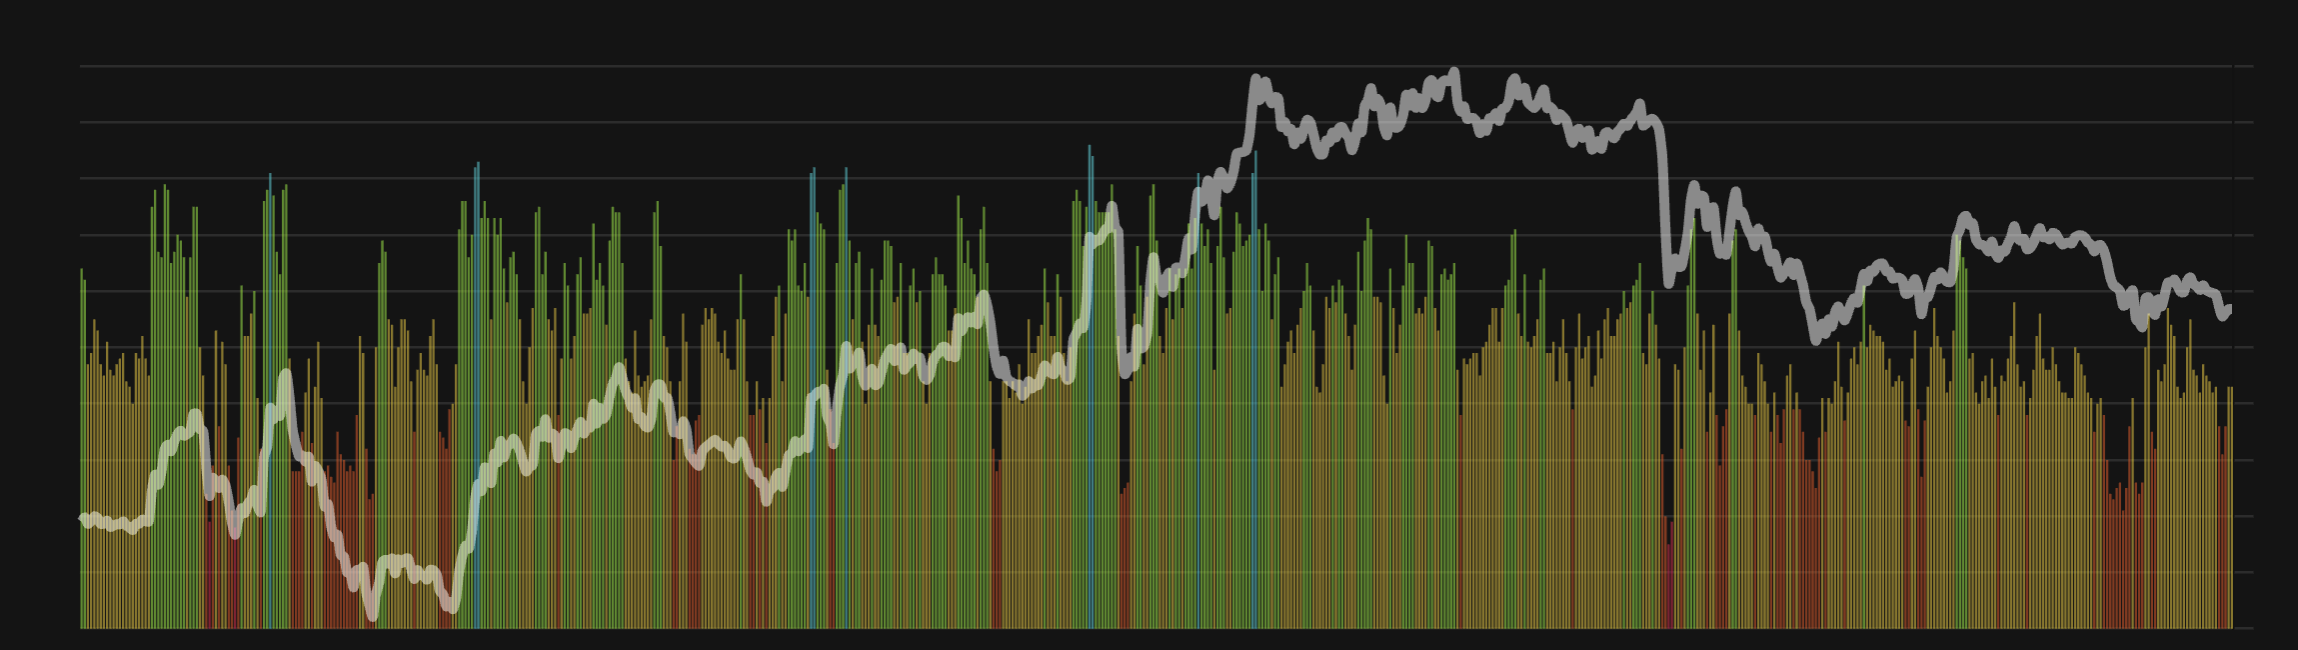
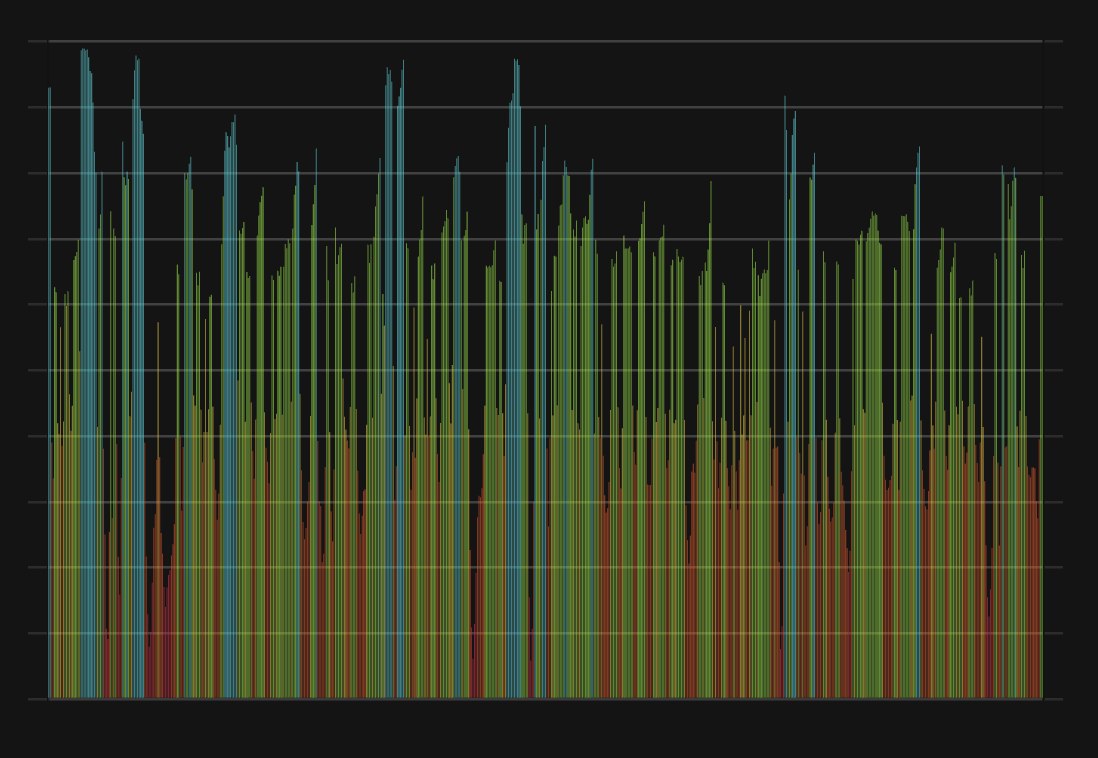
CRV Price & Curve Sentiment Breakdown Charts
Price Score Sentiment
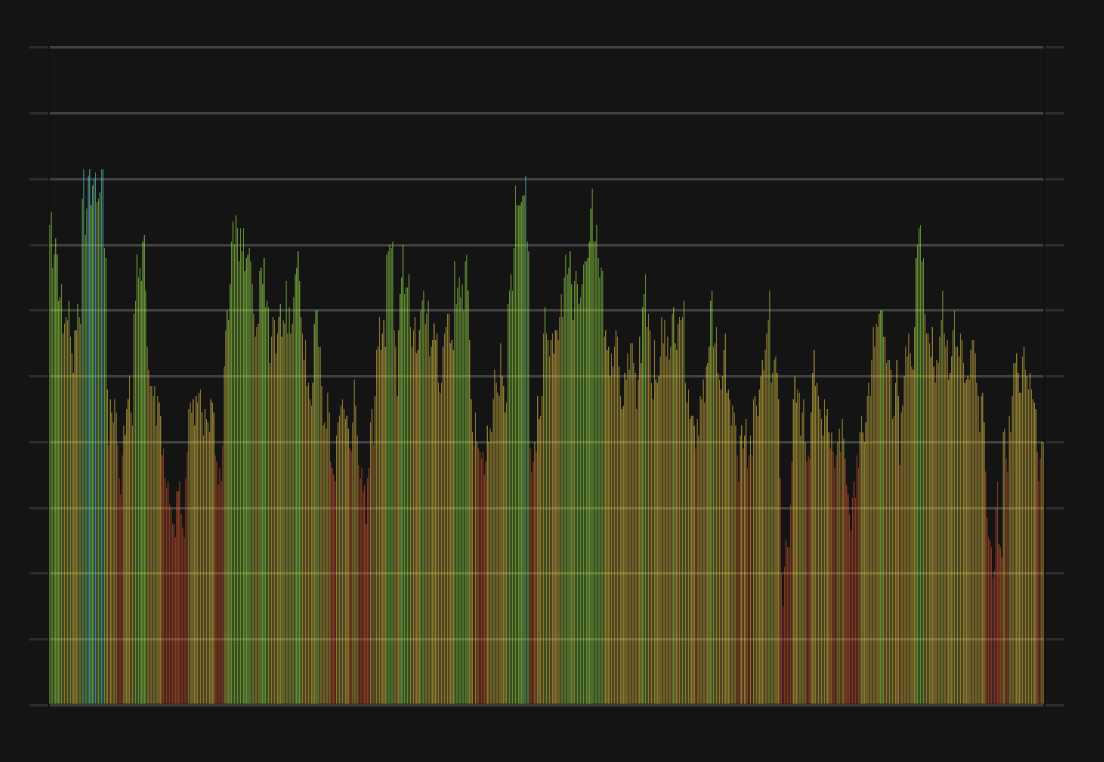
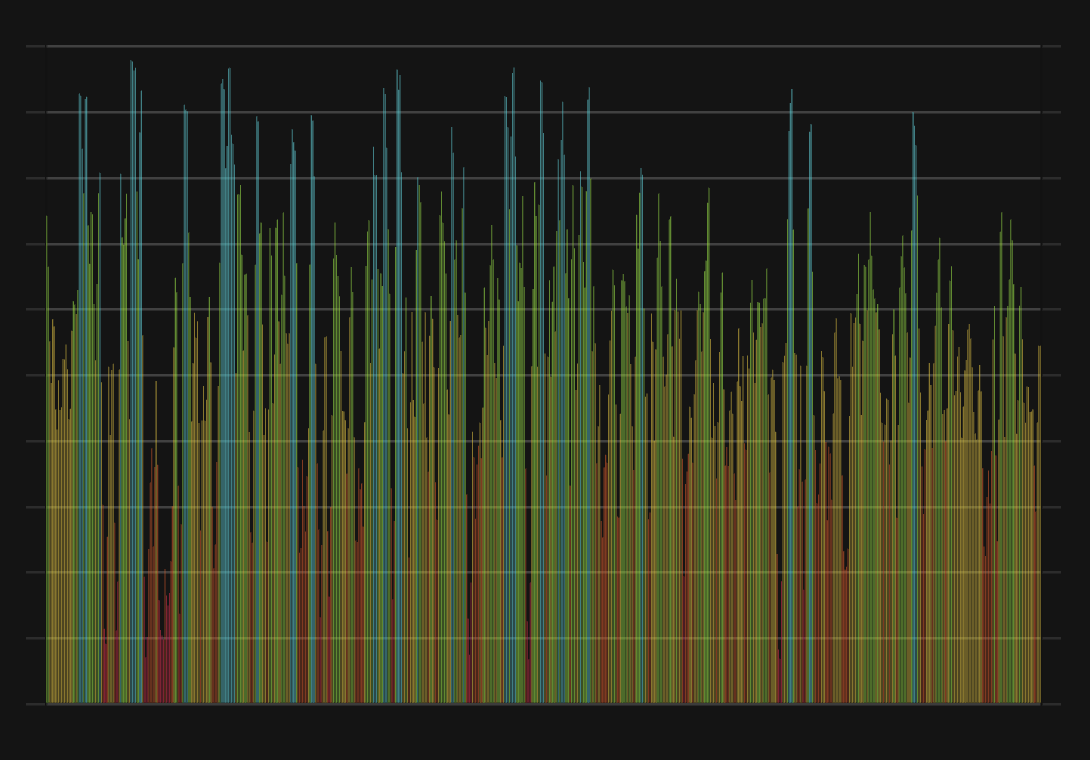
Volatility Sentiment
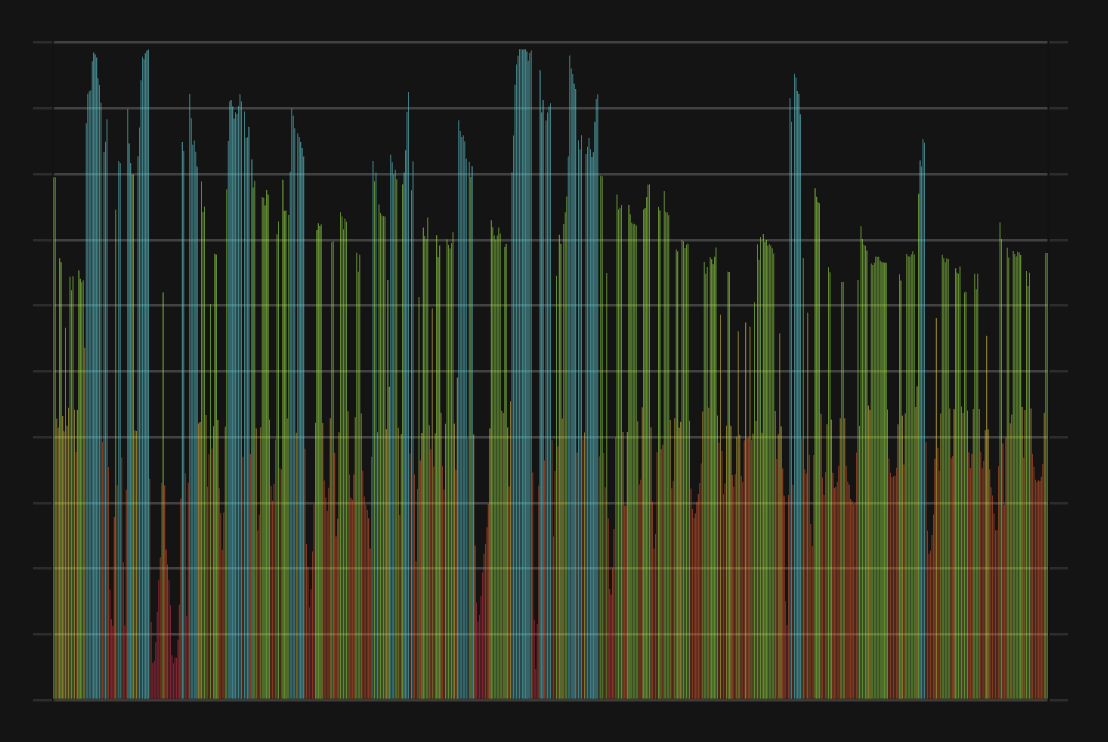
Volume Sentiment
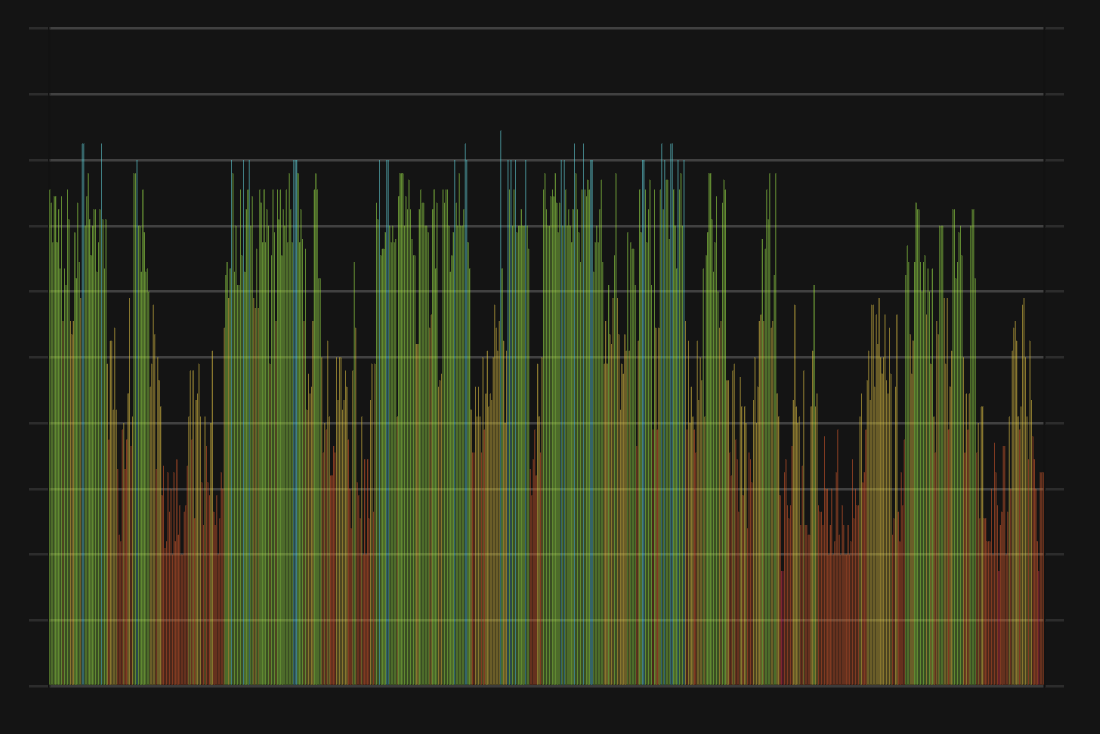
Impulse Sentiment
Technical Sentiment
Social Sentiment
Dominance Sentiment
Search Sentiment
Whales Sentiment
Order Book Sentiment